
 As a pilot, you should be familiar with the flight manual for your aircraft of choice. Aircraft flight manuals contain valuable information about how to safely operate the aircraft under various conditions, including performance charts that help the pilot better predict the behavior of the aircraft. The engineers that develop performance charts assume that the pilot is of an average skill level and that the aircraft is in good working condition.
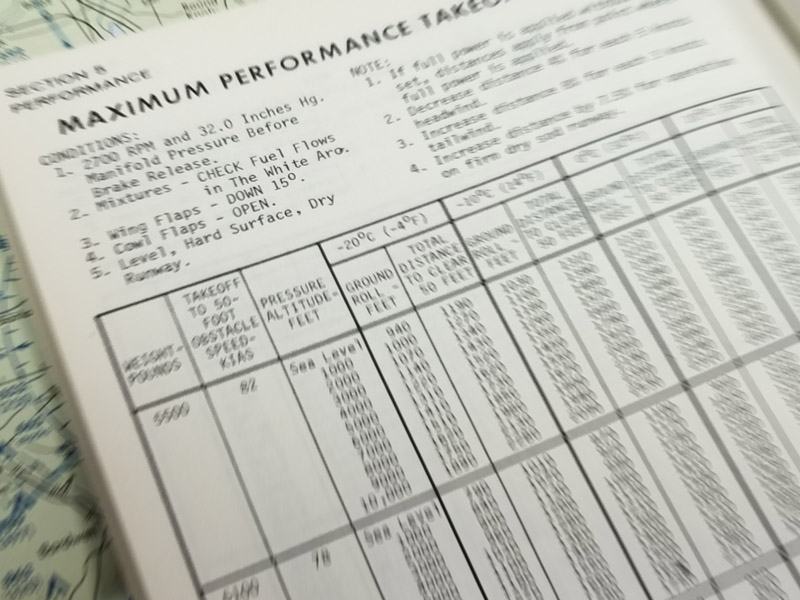
Performance charts cover the details for various actions you might take in a plane. How much distance do you need to takeoff of a paved runway? Check the charts. How much fuel is going to be consumed while climbing and cruising? Check the charts. What is the total landing distance over an obstacle with a 10-knot headwind component? Check the charts!
 The POH/AFM typically provides data taken at specific intervals. Obviously, not every combination of weather conditions, flap and gear positions, velocity, and takeoff weights (and the list of factors to consider goes on) will be found in your manual’s performance charts. When you’re not flying at one of these intervals, you have to use a process called interpolation in order to accurately plan your flight. Interpolating is when you use the information about a set of conditions listed in your performance chart and calculate a value based on your specific circumstances that falls between the given intervals.
Interpolation is actually pretty simple in theory. Here’s an easy example.
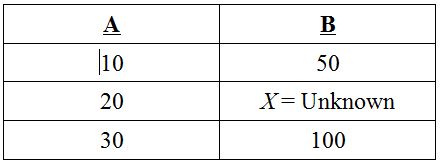
What is X? Obviously, it’s 75, we can visualize that. We know 20 is halfway between 10 and 30, so it stands that the corresponding value in column B would be halfway between 50 and 100. Easy, right?
Well, the truth of the matter is that most of the time, interpolation won’t be such a breeze. It becomes harder to visualize some numbers, so we have to come up with a systematic way to determine intermediate values. Consider the following chart.
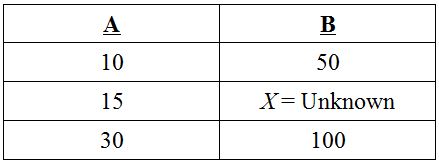
In this example, we want to interpolate the value in column B that corresponds with 15 in column A. First, we need to take stock of what we know. Since the only values we know in column B are 50 and 100, we will work with the corresponding values in column A, 10 and 30.
We can determine the relationship of 15 to the range of 10 and 30 like this

We know that 15 is ¼ of the range between 10 and 30, so the corresponding value in column B must be ¼ of the range between 50 and 100. We can calculate that range as follows.
![]()
The following formula will show you how to calculate the number of additional units to be added to our range minimum in order to arrive at the correct value.
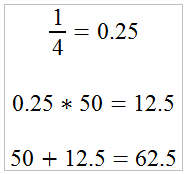
If you’ve followed along this far, the interpolation is over! 15 in column A corresponds with 62.5 in column B. In a real life scenario, the column headings would be things like Temperature or Takeoff Distance: things that have real meaning and importance when it comes to flying an aircraft. Keep in mind that these interpolated values are based on average skill and conditions. Adjust your values accordingly in order to allow a margin of safety. It’s always wiser to allow yourself a little extra takeoff distance or expect a little extra fuel consumption. Err on the side of caution!
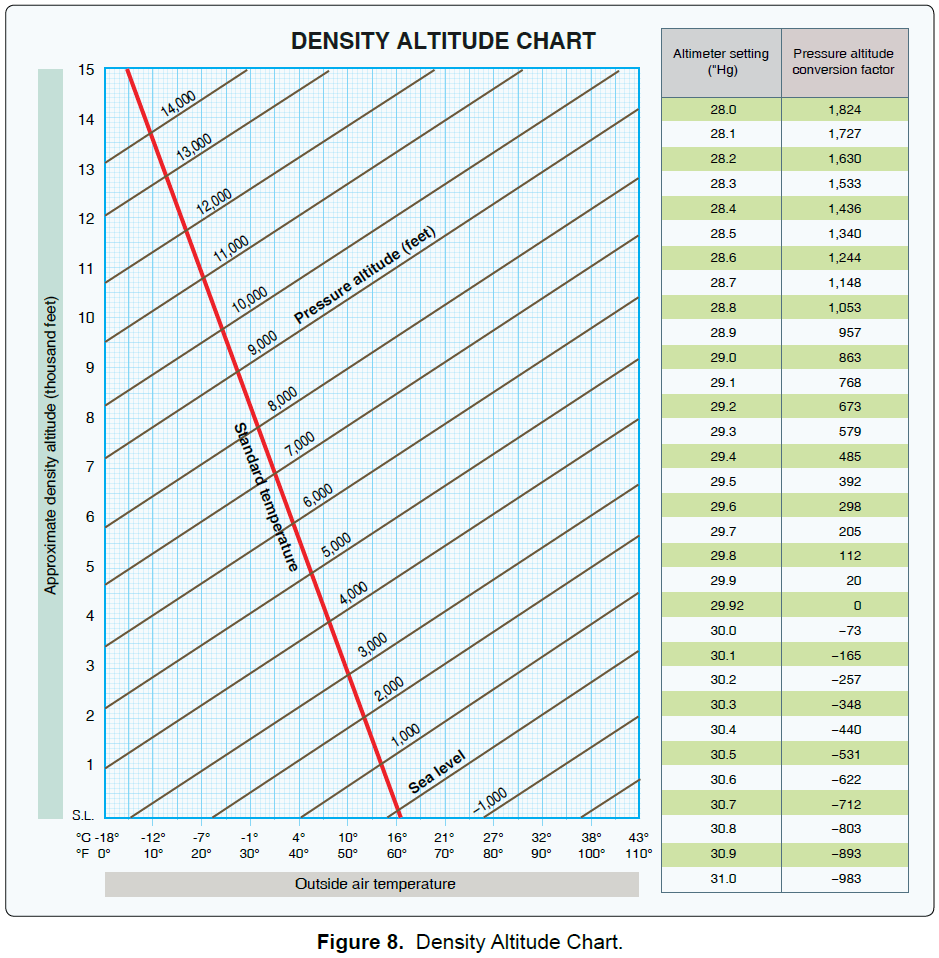
Lets put interpolation into practical use while also assuming you are preparing for a knowledge test and need to calculate a pressure altitude conversion factor. Suppose you need to determine the pressure altitude for an airport with an elevation of 330′ when the altimeter setting is 29.57”. This can be done using the density altitude chart (figure 8). This chart provides pressure altitude conversion values for altimeter settings of 29.50 and 29.60.
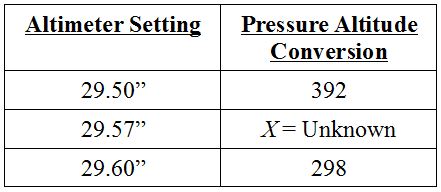
Step 1: Determine the intermediate range. Without writing out the formula, we can see that 29.57 is 7/10 (or 0.7) of the way between 29.50 and 29.60.
Step 2: Calculate the relationship of the intermediate range to the unknown data by subtracting the known variables and multiplying by the intermediate range. [(392 – 298) = 94] × 0.7 = 65.8
Step 3: Add (or subtract for inverse relationships) the additional units. Since the pressure altitude conversion is an inverse relationship (it decreases when the altimeter setting increases), we subtract the additional units from the value at the lower end of the altimeter setting range. 392 – 65.8 = 326.2.
Step 4: Finally, to determine the pressure altitude, add the field elevation and conversion factor. 330 + 326.2 = 656.2.
Dig into your aircraft flight manual and practice interpolating some values. It’s an important skill to have and you’ll likely be doing it every time you file a flight plan. If you followed along but interpolation just hasn’t clicked for you yet, open up your Gleim Private Pilot Knowledge Test Prep book to Appendix B for a more detailed look at interpolation. You can also find practice questions using interpolation in Study Units 5.2, “Density Altitude Computations,” and 5.4, “Cruise Power Settings.”
Written by Austin Scott, Marketing Assistant for Gleim Aviation
About Gleim Aviation
Since 1980, the Gleim Aviation team of pilots, instructors, writers, designers, and programmers has helped aviators pass millions of FAA knowledge and practical tests using the unique Gleim Knowledge Transfer System. Gleim is an environmentally-friendly company headquartered in Gainesville, FL.